
Americans process over 100,000+ words a day.1
Wow...talk about information overload!
So, how can we stand out?
Have you ever heard the saying, "A picture is worth a thousand words"? One study found that combining text with pictures produced a 95% rate of understanding versus 70% with just words alone.2 Humans are visual creatures. We are far more likely to read an infographic than just text.
Ok. What exactly is an infographic?
An infographic is a visual image such as a chart or diagram used to represent information or data.
Got it. Now, where do I start?
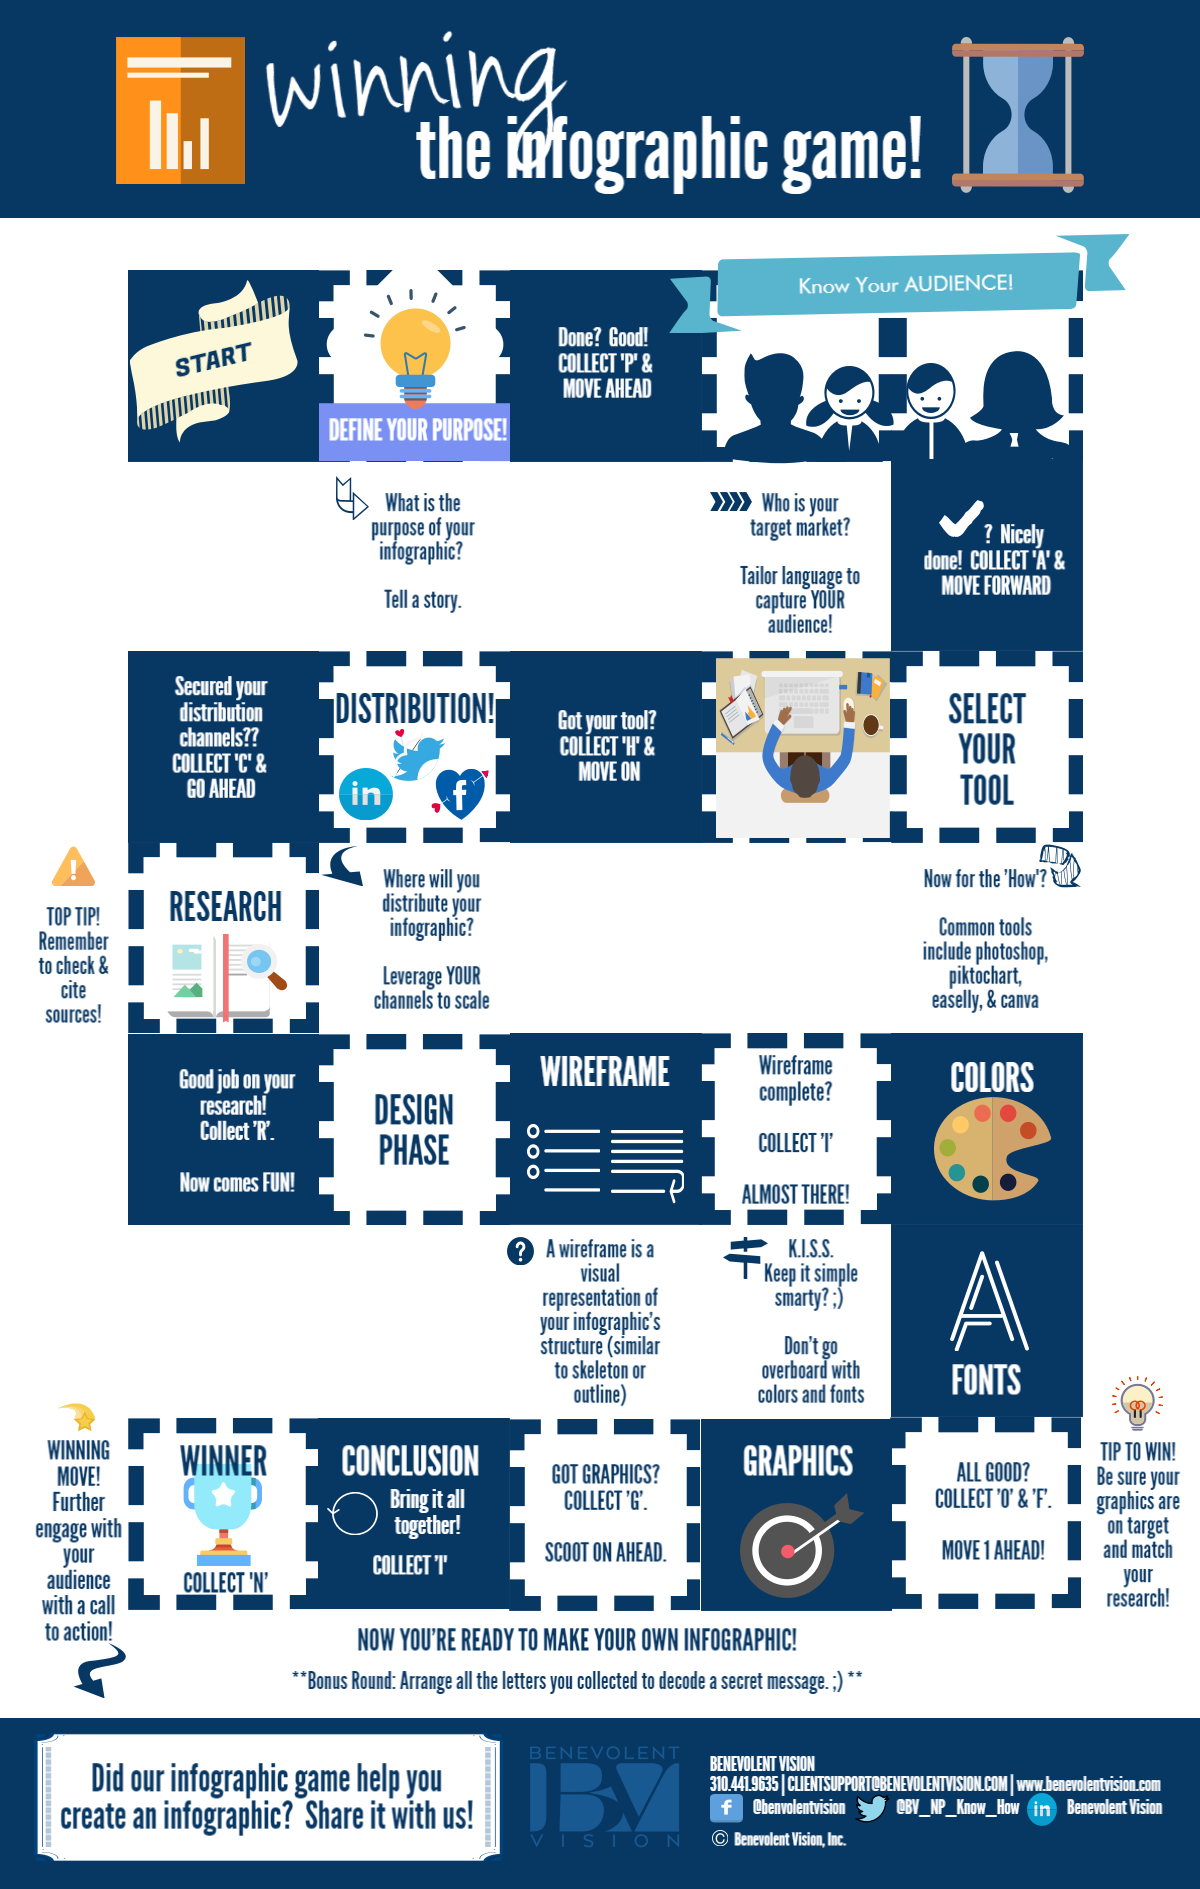
Click on the graphic below to check out the game and take YOUR first steps to winning with infographics!
Ready? Get Set. Let's GO have some FUN!
1 Bohn, R., Short, J. (2012). Measuring Consumer Information, International Journal of Communication 6
2 Dowse R., Ehlers M. (2005). Medicine labels incorporating pictograms: do they influence understanding and adherence? MEDLINE